

Equipment
Experimental group
BRILLOUIN LIGHT SCATTERING (BLS) SPECTROSCOPY
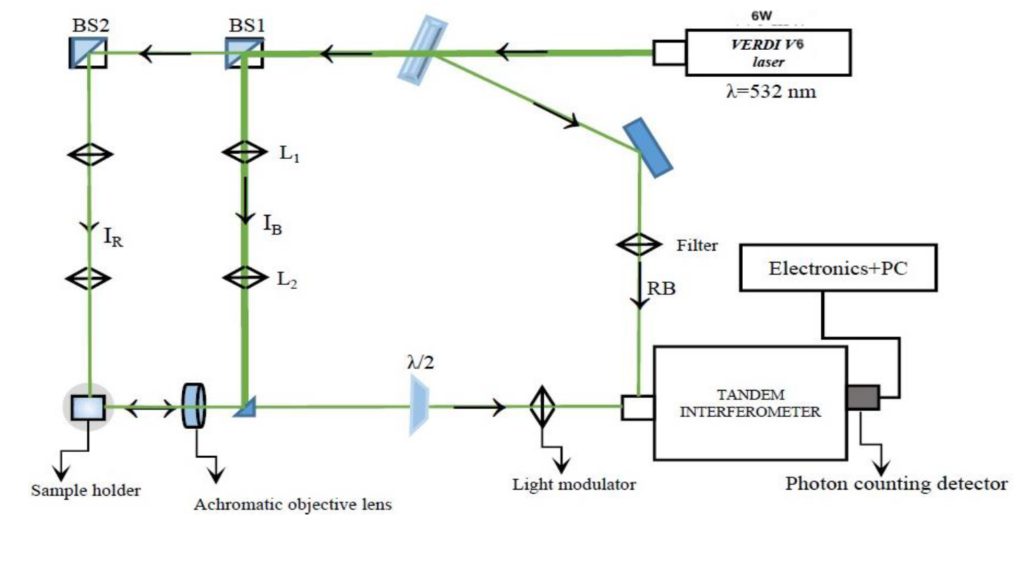
Brillouin Light Scattering (BLS) Spectroscopy is a well- established tool for characterizing materials by inelastic scattering of light. BLS experimental setup consists of a six-pass tandem Brillouin spectrometer, which ensures a contrast of 1015 and a single-mode diode-pumped laser of power 6 W (Coherent VERDI V6), emitting the second harmonics of the length λ0 = 532 nm as source light. The high contrast brings the device to unprecedented level of selectivity, and is particularly advantageous for applications where a strong elastic light component is mixed with the Brillouin signal, or when it is necessary to perform measurements very close to the elastic line.
In order to perform a Brillouin light scattering measurement, TFP spectrometers need two beams of light: the input beam and the reference beam. Both these beams come from a single laser source; the reference beam is a small fraction of the original laser beam, usually generated by means of a beam splitter, while the input beam comes as output from a scattering setup, where a relevant portion of the laser light hits a sample. Two beam splitters BS1 and BS2 (Fig.1) divides the laser power by 50/50 ratio as well as 10/90 ratio respectively. The input beam, entering from the main pinhole, contains the light that will be analysed and that carries in its spectrum interesting information about the sample under study. This beam should hit the input pinhole in the centre and be directed as orthogonal as possible to the pinhole wheel plane. The input beam must be focused to the pinhole and have an aperture not larger than f/18. The reference beam enters the spectrometers though a grey plastic diffuser, that in turn also works as a strong attenuator. The quantity of light actually entering the instrument may be tuned at any time by moving the reference beam in or out of the diffuser.
The mirror spacing is the first and most important parameter of a measurement. Once the mirror spacing is known, it is possible to calculate the free spectral range (FSR). Measurements are performing for the FSR range 5 GHz to 200 GHz. The system can only be made to operate in multimode if both interferometers have been pre-aligned parallel and with the correct relative spacing. Wave vector and frequency resolutions are 0.02×105 cm-1 and 0.04 GHz respectively. Here the optical transmission of the device is slightly larger. Only vertically polarised light entering the pinhole is efficiently analysed due to the polarising optics used inside the spectrometer. The range of temperature is 80 K to 400 K.
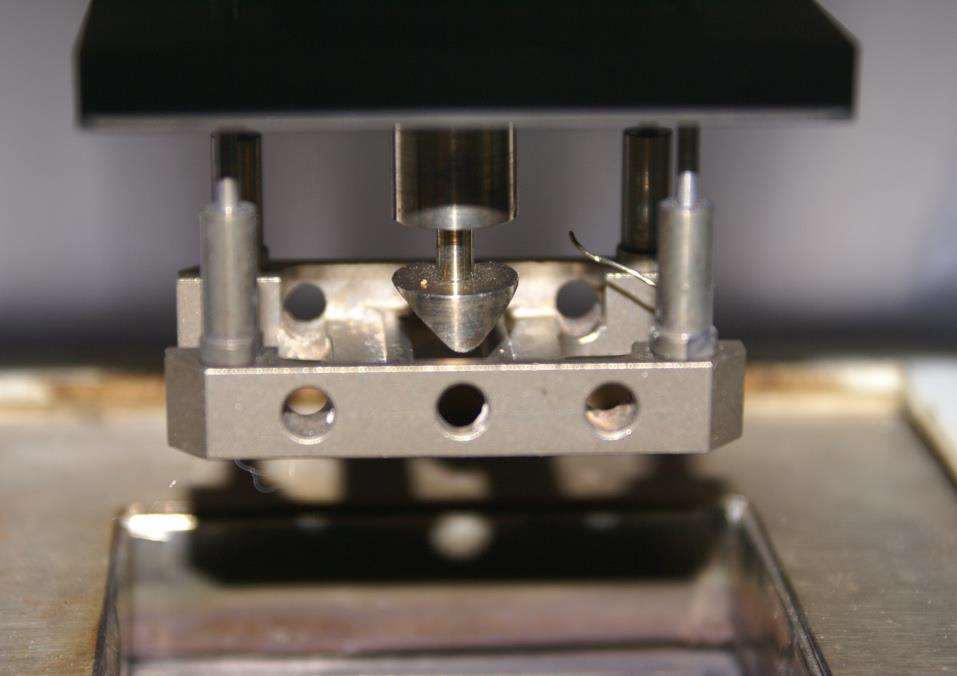
A sample holder is used to hold the samples under various magnetic fields. We can apply external magnetic field from 0 T to 1 T. The backscattering configuration is the simpler and most known arrangement for scattering experiments. There are also different geometries are possible such as Damon-Eshbach, oblique, backward volume, forward volume other phononic as well as magnonic configurations. We can extract dispersion relations of phonons and magnons from BLS measurement. In the measurement process, the wavelength (λ0) of light is analysed by detecting the transmitted light intensity upon scanning the distance of the interferometer mirrors. At appropriate angle of incidence, it permits the observation of Brillouin spectra which consist of both stokes and anti-stokes peaks. The angle of the laser beam incident onto a surface is equal to the scattering angle denoted by θ, so that, the magnitude of wave vector is given by q=(4π/λ0) sinθ.
DYNAMIC MECHANICAL ANALYSER
Dynamic Mechanical Analysis (DMA) is an indispensable tool for determining the visco-elastic and mechanical properties of materials. The system here using is – DMA 242C (Netzsch, Selb, Germany) and the associated data collection software. The dynamic-mechanical properties of visco-elastic materials are dependent on the operating temperature, the type of oscillating force applied to the sample in a defined deformation mode and the frequency or time of the applied oscillating force. Our DMA software allows to select a measuring frequency from 0.01 Hz to 100 Hz. Very low frequencies cause a slow change in the applied force and the obtained results are characterized by a very wide range of measurement errors. Therefore, it is better to perform the measurements in a sequence of frequencies. The modulus of elasticity of a polymer material is not a constant number, but a function of the temperature, time and frequency of the dynamic force applied to a specimen with a defined geometry. During the test, a sinusoidal force is applied to the sample. This results in a sinusoidal deformation. Certain materials, such as polymers, exhibit viscoelastic behaviour; i.e., they have both elastic properties and viscous ones. This viscoelastic behaviour causes shifting of the corresponding and strain curves. The deviation is referred to as the phase shift δ. The response signal (strain, ε) is split into an “in-phase” and an “out-of-phase” part by means of Fourier Transformation. There are different modes of measurement such as static modes: TMA, iso-strain, creep and dynamic modes: standard, stress and strain-sweep, multi-frequency tests and immersion tests.
DIFFERENTIAL SCANNING CALORIMETRY
Differential scanning calorimetry (DSC) is thermo-analytical technique in which the difference in the amount of heat required to increase the temperature of a sample and reference is measured as a function of temperature. Both the sample and reference are maintained at nearly the same temperature throughout the experiment. Here we are using Perkin-Elmer Heat Flow double furnace DSC 7 setup. Generally, the temperature program for a DSC analysis is designed such that the sample holder temperature increases linearly as a function of time. The reference sample should have a well-defined heat capacity over the range of temperatures to be scanned. For the DSC temperature measurements, the sample must be exchanged at room temperature. The temperature range which we using here from 80 K to 800 K.
DIGITAL MICROSCOPE
Digital microscope using here is a variation of a traditional optical microscope that uses optics and a digital camera to output an image to a monitor, by means of software running on a computer. It designed to investigate the optical properties of objects, their luminescence and polarization. This light microscope (Jenapol) equipped with a halogen light source, monochromator (l = 558.5 nm), polarizer and a rotating graduated analyser (Sénarmont compensator) is used to measure the phase difference of the incident monochromatic polarized light beam. This is visually expressed as an certain amount of black lines/bands on the sample caused by speed differences of the propagating light in the anisotropic sample. The phase difference can be read out by using a compensator which is in our case a rotating graduated analyser.